Cattle Barn Lighting: Effect of Cattle Barn Lights on Milk Yield
Milk production serves as a key measure of the lactation performance of dairy cows. Adequate lighting conditions can enhance the production capabilities of dairy cows, significantly contributing to increased milk yield. As ruminant mammals, dairy cows typically require over 12 hours of light exposure to effectively engage in activities such as feeding, exercising, rumination, and milk production. Additionally, proper light management can stimulate the secretion of prolactin in dairy cows, thereby improving both the quantity and quality of milk produced by lactating cows. Consequently, dairy farms in the plateau should implement lighting systems to fulfill the activity and production requirements of dairy cows. Research has indicated that artificially extending the daily light exposure for lactating dairy cows can lead to a notable increase in roughage intake and milk production, which can enhance the economic viability of dairy farming.
1. Materials and Methods
1.1 Experimental Design and Grouping
This study was carried out at a dairy farm in the plateau mountains from July 16 to 30. A total of 50 healthy Holstein cows, in their 3rd to 4th parity and 2nd to 3rd month of lactation, were selected and divided into 10 groups, with one group designated as the control and the other nine as experimental groups. The factors influencing milk production in the cattle barn include: A) lighting duration, B) light color temperature, and C) light intensity. Each factor was tested at three different levels to assess the impact of various lighting parameters on the milk production of lactating dairy cows. The design of the experimental factor levels is detailed in Table 1.
Table 1 Experimental factor level table

Using the experimental factors and levels outlined in Table 1. the L9(34) orthogonal experimental table was created with SPSS 27.0 software (as shown in Table 2). This resulted in a total of 9 experimental groups, each consisting of 5 cows.
Table 2 Orthogonal experiment design table

1.2 Feeding Management During the Experiment
The milk production of the test cow group was assessed on July 14 and 15 to confirm that all cows exhibited normal milk production levels. The official experiment period ran from July 16 to 30. From July 14 until the conclusion of the experiment, the concentrate, roughage, and forage composition for all cows in both the control and experimental groups remained the same.
1.3 Measurement Indicators and Methods
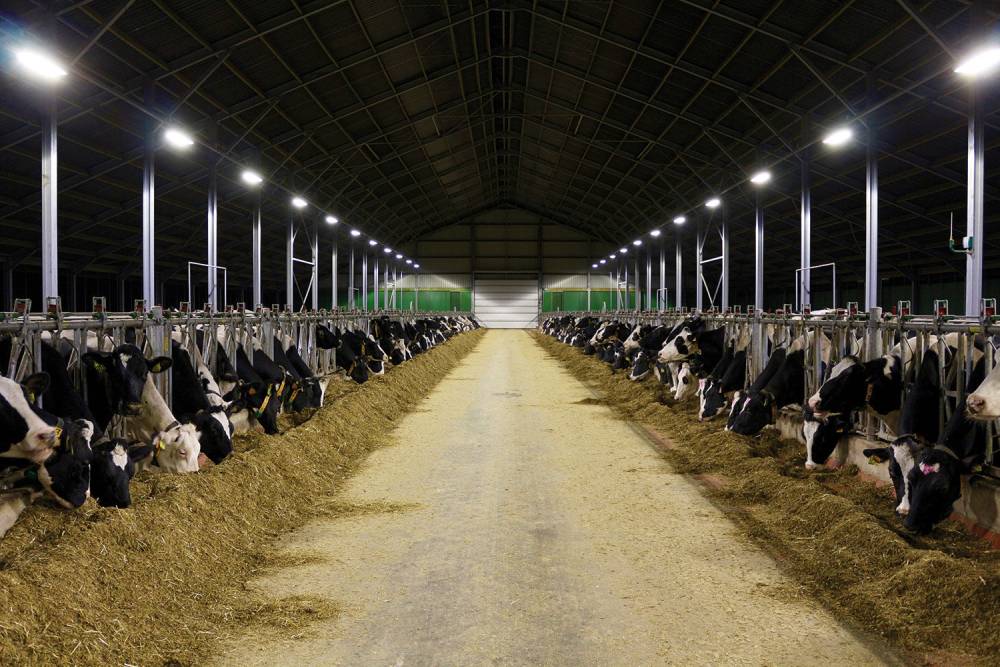
1.3.1 Cattle Barn Lighting Setup and Parameter Monitoring
Various factor levels were established based on the experimental groupings outlined in Table 2. For this experiment, a set of light detectors was positioned 60 to 80 cm above the ground beneath each light in the lactating cattle barn for monitoring purposes. The lighting was designed using specific warm-color lamps (3000k), mercury lamps (4000k), and LED lamps (5000k) to fulfill the experimental criteria.
The five cows in the control group were managed according to the farm's original lighting practices.
1.3.2 Measurement of Milk Production
The daily milk output for each group of experimental cows was recorded using the dairy farm production management system.
1.4 Data Analysis
The experimental data were analyzed with SPSS 27.0 software to assess the impact of lighting duration, light color temperature, and light intensity on the milk production of lactating cows, with a significance level set at P<0.05. Additionally, the results of the orthogonal tests were examined for interactive effects, which will inform the lighting management strategies, lamp selection, and control parameter settings for the cattle barn.
2. Results and Discussion
2.1 Milk Production Statistics During the Experiment
From July 16 to 30. 2023. the milk production for each group of experimental cows was recorded daily, and the statistical results are presented in Table 3.
2.2 Analysis of Test Results
2.2.1 Main Effect Analysis
The main effect analysis of the daily average milk production test data presented in Table 3 was performed using SPSS 27.0 statistical software to evaluate the impact of light exposure duration, light color temperature, and light intensity on milk production. The findings are summarized in Table 4: The significance P value for factor A is 0.002. which is below the 0.05 threshold. The significance P value for factor B is 0.004. also below 0.05. In contrast, the significance P value for factor C is 0.066. exceeding 0.05. Consequently, the main effects of factor A (light exposure duration) and factor B (light color temperature) are deemed significant (P<0.05), indicating they influence milk production.
Table 3 Milk production of dairy cows in each group

Table 4 Test of between-subject effects

2.2.2 Detailed Comparison and Intuitive Analysis
Using the statistical information presented in Table 3. we calculated the variation in average daily milk production for each test group by comparing the reference period with the test period. These changes in milk production were documented in the intuitive analysis table found in Table 5.
Table 5 Intuitive analysis calculation table

The column for factor A in Table 5 shows that its three levels were tested in three different experiments. For instance, level A1 (10h) was involved in the tests S-4. S-7. and S-9. The total of A1's results is noted as K11. and the average of these results is also recorded as K11. Specifically:
K11 = 5.79 + 10.86 + 13.82 = 30.47. Thus, K11 = K11/3 = 10.16. The approach to calculating the sum and average of the test results for other factors follows the same method as for A1. The differences among K11. K12. and K13 highlight the variations among the three levels of factor A. The quality of these levels can be assessed by their average values. For example, in Table 5. K12 > K13 > K11 indicates that A2 (15h) is the most effective level.
Consequently, the optimal combination identified in Table 5 is A2-B1-C3. This means that when the lighting conditions in the lactating cattle barn are set to 15 hours of light, a color temperature of 3000 K, and an illumination level of 200 lx, the increase in milk production is maximized.
2.2.3 Analysis of the Range of Lighting Factors Affecting Milk Production
According to Table 5. the range for A (lighting duration) is 11.42. for B (lighting color temperature) it is 6.61. and for C (lighting intensity) it is 6.4. This indicates that A (lighting duration) has the widest range and the most significant impact, making it the primary influencing factor. To emphasize the average differences at each level of the influencing factors, Figure 1 illustrates that the optimal lighting combination is A2-B1-C3. which aligns with the findings from the overall comparison and visual analysis.
Figure 1: Level averages of each factor

2.2.4 Analysis of a single statistical factor
Table 6 Milk production under single factor A

Table 7 Multiple comparisons of milk yield at each level under single factor A

Using single factor analysis within the general linear model in SPSS 27.0. Table 6 shows that A2 has the highest average additional milk production at 21.580 kg. The average additional milk production for the three levels of factor A ranks from smallest to largest as A1. A3. and A2. Table 7 indicates that the differences in average values between A2 and both A1 and A3 are statistically significant, confirming that A2 represents the optimal level for factor A.
Table 8 reveals that B1 has the highest average additional milk production at 20.657 kg, with the average values for the three levels of factor B ordered from smallest to largest as B3. B2. and B1. According to Table 9. the differences in average values among B1. B2. and B3 are significantly different, indicating that B1 is the best level for factor B.
Table 10 shows that C3 has the highest average additional milk production at 20.663 kg, with the average values for the three levels of factor C arranged from smallest to largest as C1. C2. and C3. Table 11 demonstrates that the differences in average values between C3. C1. and C2 are significantly different, establishing C3 as the optimal level for factor C.
Table 8 Milk production under single factor B

Table 9 Multiple comparisons of milk yield at each level under single factor B

Table 10 Milk production under single factor C

Table 11 Multiple comparisons of milk yield at each level under single factor C

The A2-B1-C3 light control combination mode significantly boosts milk production, aligning with findings from both comprehensive comparative intuitive analysis and range analysis. This indicates that the best lighting setup for the lactating cattle barn at this dairy farm is A2-B1-C3.
This study identified three key lighting factors that influence milk production and performance in lactating cows on plateau dairy farms: light duration, color temperature, and illumination. An orthogonal test with three factors at three levels was conducted using SPSS 27.0 software. Analysis of the experimental data revealed that light duration and color temperature were the primary factors affecting milk production. The data were further examined using comprehensive comparative intuitive analysis, extreme difference factor analysis, and single factor statistics. Ultimately, it was determined that the lactating cows produced the most milk under lighting conditions of 15 hours of light, a color temperature of 3000K, and an illumination level of 200lx.
In contemporary large-scale dairy farming, the breeding environment plays a crucial role in the production performance of lactating cows. However, there is currently no standardized approach or specific metrics for effective management and control. Besides the lighting conditions discussed in this study, other environmental factors that significantly impact milk production include air quality, temperature and humidity, and noise levels in the cattle barn. Given that intelligent dairy farming in plateau regions is still developing, this research aims to provide insights into how lighting affects milk production in lactating cows and to utilize expanded orthogonal experiments and data analysis to establish optimal lighting parameters. This could assist in enhancing the breeding environment in similar dairy farms and ultimately improve the milk production and quality of lactating cows in large-scale operations.
3. Related Product

4. Related Blog