Chicken Coop Lighting for Egg Production
Directory:
1 Materials and Methods
1.1 Experimental Animals
1.2 Light Source
1.3 Recording and Testing Indicators
1.4 Data Analysis
2 Results and Analysis
2.1 Impact of LED Lights on Laying Hens' Production Performance
2.2 Effects of LED Light Application on Laying Hens' Production Performance
2.3 Evaluation of the Energy-Saving Benefits of LED Lamps
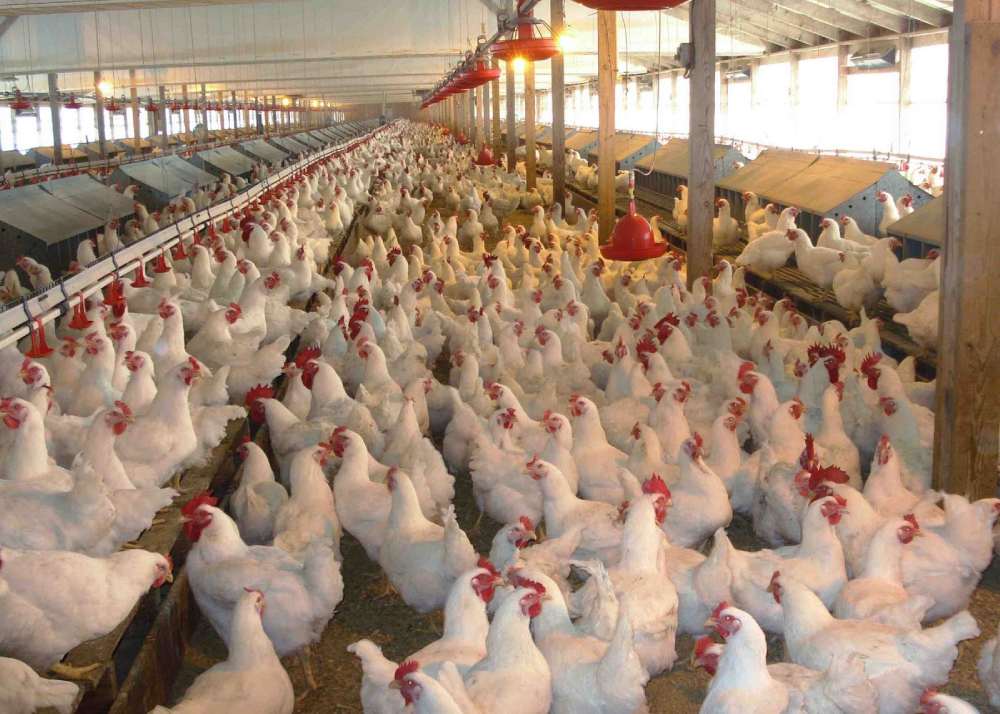
LED stands for light-emitting diode, which is a solid-state semiconductor device capable of converting electrical energy into visible light with high efficiency. Compared to incandescent and energy-saving lamps commonly used in egg-laying chicken farms, LED lamps offer several benefits, including energy efficiency, a long lifespan, no radiation, no flickering, and environmental friendliness. Reports indicate that LED lamps consume only one-tenth the energy of incandescent lamps of equivalent brightness, one-quarter that of fluorescent lamps, and half that of energy-saving lamps. Their durability reduces the frequency of bulb replacements, thereby lowering costs and minimizing the workload associated with changing lamps. Typically, LED lamps can last over 50.000 hours, while incandescent lamps last around 1,000 hours and energy-saving lamps about 5,000 hours. The use of LED lighting technology in poultry farming has gained significant attention, making LED light sources a promising option for artificial lighting in large-scale poultry operations. This study investigates the impact of LED lamps on the production performance of caged Hy-Line grey commercial laying hens and assesses their energy-saving potential, aiming to provide insights for the use of LED lighting.
1 Materials and Methods
1.1 Experimental Animals
The experiment was conducted from January 1 to November 31. involving 20,000 Hy-Line grey commercial laying hens aged 241-570 days, with 10,000 hens in both the experimental and control chicken coops. Each coop was randomly divided into four replicates, with 2,500 hens per replicate, and production performance was recorded separately for each. Both chicken coops had identical basic conditions, featuring closed environments, mechanical ventilation, and mechanical manure removal. The experimental and control groups received the same diet, with unrestricted access to food and water, and consistent feeding management and nutritional levels, adhering strictly to the laying hen feeding and management guidelines.
1.2 Light Source
The experimental group utilized 9W LED lamps, while the control group used 20W energy-saving lamps. During installation, care was taken to adjust the position and height of the lamps to ensure that the illumination intensity at the chicken head level met the requirements for different growth stages and remained consistent across both setups. The lighting schedule for the experimental group was 14+1 hours, while the control group followed a 16-hour lighting program.
1.3 Recording and Testing Indicators
Throughout the experiment, daily counts were taken of the number of chickens, eggs produced, egg production rates, broken and soft eggs, feed consumption, and the number of dead or culled chickens in both the experimental and control groups.
1.4 Data Analysis
The experimental data were organized using Microsoft Excel to determine the egg production rate, average egg weight, rates of broken and soft eggs, feed-to-egg ratio, and mortality and culling rates. Statistical significance testing was conducted using SAS 9.2 software.
2 Results and Analysis
2.1 Impact of LED Lights on Laying Hens' Production Performance
The introduction of LED lights during the egg-laying phase had minimal impact on the overall production performance of the flock, with no significant change in egg production rates (P>0.05). However, the average egg weight in the experimental group was significantly lower (P<0.01). While the rate of broken eggs in the experimental group was lower than in the control group, this difference was not statistically significant (P>0.05). There were no significant differences in the rates of soft eggs or mortality, although the experimental group did show a lower mortality rate. The feed-to-egg ratio was significantly lower in the experimental group (P<0.01). Overall, while the egg production rate in the experimental group showed a slight increase, the average egg weight decreased significantly, and individual egg production was lower than in the control group. Feed consumption increased, while the rates of broken eggs and mortality decreased, indicating a slight reduction in the egg-laying performance of chickens under LED lighting.
2.2 Effects of LED Light Application on Laying Hens' Production Performance
2.2.1 Average Egg Production Rate Trend
As illustrated in Figure 1. the egg production trends for both the experimental and control groups were largely similar. The control group's egg production curve declined gradually compared to the experimental group. After one month of LED light application, the egg production rate for the experimental group was (96.17±0.174)%, surpassing the control group's rate of (94.62±0.243)%. However, after eleven months of application, the egg production rates for both groups were nearly identical.
2.2.2 Trend in Average Egg Weight
As illustrated in Figure 2. the average egg weight for both groups exhibited a consistent monthly increase. After one month of treatment, the control group's average egg weight was (57.85±0.593)g, significantly surpassing the experimental group's average of (55.59±0.18)g. By the end of the 11th month, the control group's average egg weight had risen to (62.03±0.913)g, while the experimental group's average reached (59.15±0.133)g.
fig1 The effect of LED lights on average egg production
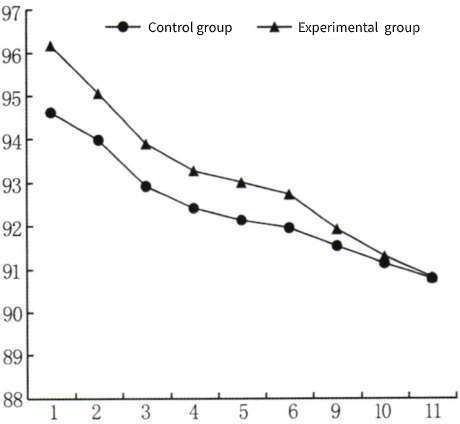
The vertical axis is the average egg production rate (%), and the horizontal axis is the month
fig2 Effect of LED lighting on average egg weight
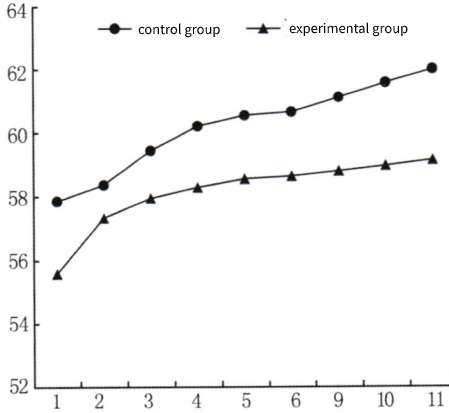
The vertical axis is the average egg weight (g), and the horizontal axis is the month
2.2.3 Trend of Average Soft Egg Rate
As illustrated in Figure 3. the average soft egg rate for both groups was notably higher during the first two months, with the control group at (0.0029±0.00062)% and the test group at (0.0032±0.0013)%. Following this period, the soft egg rate in the test group saw a significant decline, while the control group experienced an increase, peaking at three months before subsequently decreasing. After 11 months, the average soft egg rates of both groups were quite similar.
fig3 The effect of LED lights on average soft egg rate
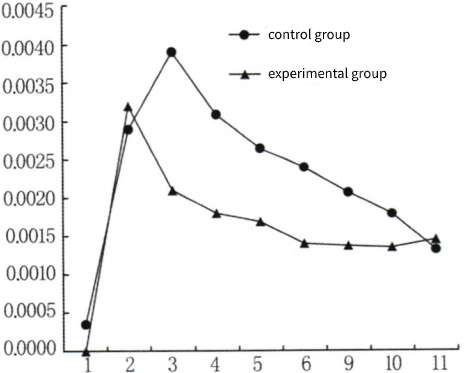
The vertical axis is the average soft egg rate (%), and the horizontal axis is the month
2.2.4 Trend of Average Egg Breaking Rate
As illustrated in Figure 4. the average egg breaking rate in the experimental group has generally been lower than that of the control group, with the exception of the 9th month of the study. One month after the start of the experiment, the egg breaking rate for the experimental group was (0.131±0.0184)%, compared to (0.289±0.0057)% for the control group, showing a significant difference (P<0.01). After 11 months, the egg breaking rate for the experimental group was (0.206±0.012)%, while the control group had a rate of (0.226±0.019)%. Although the experimental group remained lower, the difference was not statistically significant (P>0.05).
fig4 The effect of LED lights on average egg breaking rate
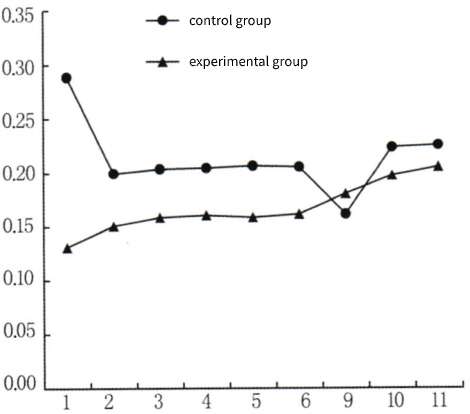
The vertical axis is the average egg breaking rate (%), and the horizontal axis is the month
2.3 Evaluation of the Energy-Saving Benefits of LED Lamps
The chicken coop on the farm is completely enclosed. The LED lamps operate on a 14+1 hour lighting schedule, which saves one hour daily compared to the 16-hour schedule of energy-saving lamps. Each of the two chicken coops is equipped with 100 LED and energy-saving lamps. The energy-saving lamps consume 32 kilowatt-hours of electricity daily, while the LED lamps use only 13.5 kilowatt-hours. By utilizing LED lamps, the farm can save 6,752.5 kilowatt-hours of energy annually, which translates to a savings of approximately ¥0.5 per kilowatt-hour, resulting in an annual savings of ¥3,376.25 for every 10,000 chickens.
3. Lighting influences the growth, development, sexual maturity, ovulation, and egg production of laying hens. Research indicates that using LED lamps during the laying phase does not significantly affect the egg production rate or the quality of the eggs (P>0.05). Similarly, during the rearing phase, LED lamps do not significantly impact the survival rate of ducks (P>0.05). Observations during the study revealed that chickens exposed to yellow LED lighting had the lowest food intake, the highest growth rates, and exhibited no aggressive behavior. Typically, around 10% of chickens display aggression under incandescent lighting. To date, no negative effects of LED lighting on chicken production have been identified.