Led Outdoor Basketball Court Lighting Design Solution

Directory:
1. Current Status and Evaluation Methods for Outdoor Basketball Court Lighting
2. Design of an Energy-Efficient Lighting Solution
3. Simulation and Analysis of the Lighting Solution
To enhance the lighting quality in sports venues, it is crucial to conduct secondary optical design for LED light sources. Conventional lighting design for sports facilities typically focuses solely on achieving uniform illumination by increasing the power and number of fixtures, which can lead to issues such as excessive glare and energy waste that need immediate attention. Since the choice of lighting fixtures, design schemes, and calculation methods vary for different venues, this paper uses an outdoor basketball court as a case study for optimization. It begins by examining the factors contributing to the inadequate use of stadium lighting. Next, it selects various lighting fixtures and develops optimized lighting plans, followed by software simulations to analyze and refine these designs. This process aims to enhance lighting quality and efficiency, ultimately achieving energy savings and reduced emissions.
1. Current Status and Evaluation Methods for Outdoor Basketball Court Lighting
1.1 Outdoor Stadium Lighting
In contrast to indoor venues, outdoor stadium lighting fixtures are challenging to install, requiring high poles to be positioned around the perimeter to support the lamps. This limits installation to the venue's edges. If the vertical lighting approach used in indoor stadiums is applied, it results in low illumination at the center while directing excessive light towards the periphery, leading to significant light waste.
To fulfill lighting requirements, high pole lighting must be set at a specific elevation angle. If this angle is too steep, it can cause a substantial amount of light to shine directly into spectators' eyes, resulting in high glare levels that can disrupt normal sporting activities.
1.2 Lighting Quality and Glare Evaluation Methods
Key indicators for evaluating stadium lighting include horizontal illuminance, uniformity of illuminance, and glare index. Horizontal illuminance (Eh) measures the density of luminous flux on the horizontal plane of the competition area. The standard horizontal illuminance values for international basketball competitions are listed in Table 1.
Table 1 Standard value of horizontal illuminance in international basketball games

Illuminance uniformity consists of two components: U1 and U2. U1 is the ratio of the minimum to maximum illuminance on the measurement surface, while U2 is the ratio of the minimum to average illuminance. The standard values for illuminance uniformity at the international basketball competition level are provided in Table 2.
Table 2 Standard value of horizontal illuminance uniformity in international basketball games

Outdoor sports facilities are primarily assessed based on glare value (GR). Research indicates that the outdoor glare assessment method suggested by the International Commission on Illumination (CIE) is also applicable to indoor venues, meaning that glare levels can be quantified using GR for both indoor and outdoor settings. A review of national standards reveals the glare limit values for outdoor venues, which are presented in Table 3.
Table 3 Glare limit of outdoor venue

2. Design of an Energy-Efficient Lighting Solution
Figure 2(a) illustrates the lighting layout of a conventional lighting scheme. The outdoor stadium lighting is significantly inefficient, primarily due to the use of traditional symmetrical lamps that emit light uniformly in all directions, resulting in excessive light spilling outside the venue.
To address the unique structural and installation requirements of outdoor stadiums, this paper presents two proposed solutions.
Solution 1: Utilize the current symmetrical light distribution lamps. By adjusting the installation angle of the lamps, as depicted in Figure 2(b), the light can be directed more towards the center of the venue, enhancing the effective use of light. However, to ensure that most of the edge light illuminates the venue, a higher elevation angle must be set, which may lead to issues such as uneven lighting and increased glare, ultimately compromising lighting quality.
Solution 2: Implement asymmetric light distribution lamps. These lamps are commonly used in road lighting, as shown in Figure 2(c). By employing secondary optical design for the lamp structure and lens, the light output can be directed to one side. This adjustment of the light distribution curve allows for more uniform illumination and reduces glare through thoughtful lighting design, resulting in improved lighting performance.
Consequently, this paper advocates for the second solution and introduces a method to enhance the efficiency of lighting in sports venues while ensuring that the glare remains below industry standards. The schematic of the lighting system is presented in Figure 3. featuring six lamp positions labeled L1 to L6. To minimize horizontal light waste from symmetrical distribution, all lamps are oriented to be horizontally polarized, directing light inward towards the venue.
Fig. 2 Schematic diagram of lighting lamps light. (a) Symmetrical type; (b) rotationally symmetrical type; (c) horizontal and vertical deflected lighting
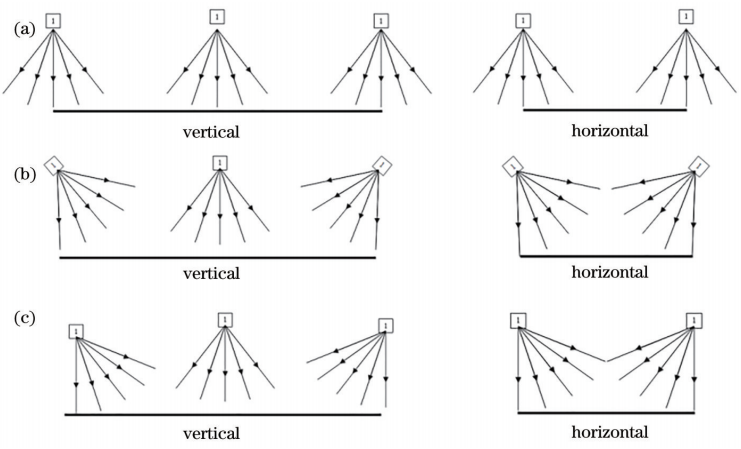
Fig. 3 Schematic diagram of energy-saving lighting system
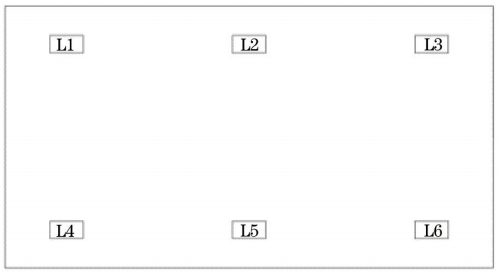
The LED lamps (L1. L3. L4. L6) positioned at the corners of the venue emit some light outside the venue in the longitudinal direction, leading to light wastage. To address this, the design of the corner LED lamps will incorporate longitudinal polarization, allowing for both horizontal and longitudinal polarized light. By polarizing the light that escapes outside the venue, we aim to enhance the efficiency of light usage.
3. Simulation and Analysis of the Lighting Solution
3.1 Venue Model Creation
A model of an outdoor basketball court has been established. Using spatial editing and the point-pulling method, a top view of the court is created. Following international standards for basketball court dimensions, the first observation surface is set to 28 meters in length and 15 meters in width. Taking into account the effective area, which includes a 2-meter edge width, the second observation surface is configured to be 32 meters long, 19 meters wide, resulting in an area of 608 m². Details are illustrated in Figure 4(a).
3.2 Lamp Installation Configuration
The lighting scheme is developed using DIALux software. The IES file for the LED lamp light source, designed and simulated in TracePro, is imported into DIALux.
In the secondary optical design, the lamp's light output is influenced by the optical lens utilized. It is noted that scaling the overall luminous flux will only impact the average illumination, without affecting overall uniformity or glare levels. For varying illumination needs, adjustments can be made by proportionally increasing the power or number of lamp modules, eliminating the need for further optimization. This paper uses the training ground as a case study, with an illumination requirement of 300 lx for an area of 19×32=608 m². The total luminous flux required is at least 182.400 lm. After conducting multiple simulations, the luminous flux for a single lamp is set at 36.000 lm, leading to a total luminous flux of 6×36.000=216.000 lm to adequately meet the requirements.
Fig. 4 Schematic diagram of basketball court lighting. (a) Length and width of the court; (b) lamps installation effect

3.3 Arrangement of Stadium Lights and Placement of GR Observation Points
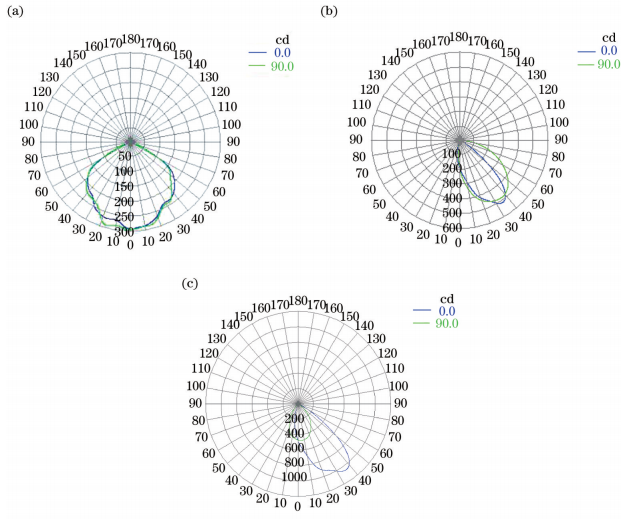
Six LED light fixtures have been installed, as illustrated in Figure 4(b). The design and optimization involve symmetrical types, as well as bidirectional and unidirectional deflected lighting. The light distribution curves are presented in Figures 5(a) to (c).
Fig.5 Distribution curves of lamps. (a) Symmetrical type; (b) horizontal and vertical deflected lighting; (c) oneside deflected lighting
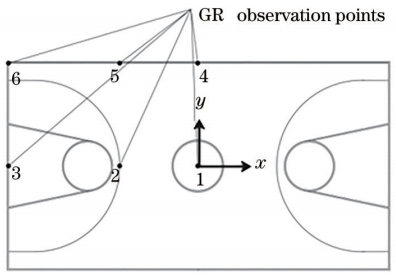
The coordinates of the observation points are established by referring to national standards and relevant documents that align with actual engineering practices and standard requirements. Given that the lamp layout is symmetrical along both the x-axis and y-axis, the observation point is positioned at one-quarter of the field area, with other areas symmetrically arranged around it. By disregarding external factors, the illumination uniformity and glare metrics for the other areas remain consistent, eliminating the need for multiple observation points.
Additionally, GR observation points are introduced to assess glare levels. The specific locations for these GR observation points are illustrated in Figure 6. A total of six observation points are designated, with an observation height of 1.5 meters, which closely matches the height of typical human eye movement. The x and y coordinate axes are depicted in the figure, while the z axis represents the observation height of 1.5 meters.
Fig. 6 Setting diagram of GR observation points
3.4 Simulation and Numerical Analysis
1) Symmetrical Lighting Configuration
To effectively assess the differences in lighting effects before and after optimization, this study initially employs symmetrical LED lamps. The lamps are positioned at a height of 8 meters with an elevation angle of 15°. A single lamp is simulated with 100.000 rays, contributing to a total of 600.000 rays (as noted in subsequent sections). The resulting pseudo-color image from the simulation is displayed in Figure 7(a), while the illuminance calculation results are presented in Figure 7(b).
From the pseudo-color image, it is evident that the overall illumination uniformity is lacking, particularly with insufficient lighting in the center of the area. The final illumination uniformity is recorded at 0.58. and the average illuminance is merely 93 lx, which is inadequate for standard usage.
2) Energy-Efficient Lighting Solution
By modifying parameters such as the spacing and height of the lamps, optimal lighting is achieved with a lamp distance of 10 meters and a height of 8 meters. The pseudo-color image illustrating this setup is shown in Figure 8(a). Analysis indicates that the light is predominantly focused in the center of the area, resulting in good uniformity across the competition venue.
Fig. 7 Symmetrical lighting scheme simulation results. (a) Pseudo-color diagram; (b) illuminance calculation numerical chart

Fig. 8 Energy-saving lighting scheme simulation results. (a) Pseudo-color diagram; (b) illuminance calculation numerical chart

Figure 8(b) presents the numerical chart for illuminance calculations. The analysis of the data indicates that the average illuminance is 306 lx, which is sufficient for daily training and amateur competitions. During the actual construction of the site, the lamp power can be adjusted based on the specific type of venue to enhance the average illuminance. The uniformity of illuminance is measured at 0.85. which satisfies the standards for professional competitions and television broadcasts, resulting in effective lighting.
3) Glare Value Analysis
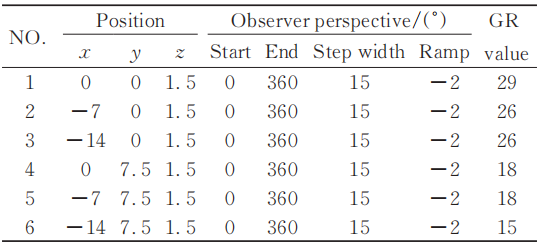
Once the illumination meets the necessary standards, the GR value for each point is calculated using software, and these values are then compared to the CIE standard to assess whether the designed stadium complies with CIE requirements. The GR values obtained are listed in Table 4. From Table 4. it is evident that the maximum glare value in the design is 29. significantly lower than the threshold of 50. thus fulfilling the lighting criteria for various competitions.
Table 4 GR value calculation table
4) Efficient Use of Light
Following the assessment of illumination and glare, this paper delves into the overall light efficiency of the lighting design. The competition area, which includes the surrounding effective space, has a total area of S = 19×32= 608 m².
The average illumination level in this space is 265 lx, leading to an effective luminous flux of Φ = 265 lx × 608 m² = 161.120 lm. Consequently, the light utilization rate is calculated as η = 161.120/216.000 ≈ 75%.
In contrast to the traditional sports lighting systems, which have a light utilization rate of less than 60%, the design proposed in this paper shows a significant improvement. This advancement is crucial for the retrofit of existing stadium lighting systems and can yield substantial economic benefits.
Additionally, an analysis of the illuminance calculation chart for the symmetrical lighting scheme reveals a light utilization rate of only 52%, indicating a serious deficiency in effective light usage compared to the optimized rate of 75%.
This paper evaluates the current state of outdoor basketball court lighting, identifying issues such as high glare levels and low light utilization rates. To address these challenges, the lighting fixtures and schemes have been optimized. Initially, a polarized lighting scheme was developed to minimize light spill outside the venue and enhance light efficiency. Subsequently, a comprehensive lighting scheme was created, with the GR observation point established. DIALux software was employed for simulation analysis and optimization, achieving an overall illumination uniformity of 0.85 and a maximum GR of 29. which is significantly below the glare threshold for outdoor stadiums. This uniformity and glare management meet the requirements for various competitions. Ultimately, the light utilization rate is determined to be 75%, a notable improvement over the existing scheme's 52%. This energy-saving outcome demonstrates considerable potential in the market.
4. Related Blog
Indoor Basketball Court Lighting System